How LiDAR Mapping Helps Golf Courses Manage Water, Plan Improvements, and Put Resources Where They Matter

If you manage a golf course in Minnesota, Wisconsin, or Iowa, you’re balancing healthy turf, playable conditions, water use, and a maintenance budget that only stretches so far. LiDAR mapping provides a measured view of the course’s terrain, helping superintendents, owners, and their engineering teams understand drainage concerns, plan improvements, and document changes over time. The value isn’t simply a colorful map — it’s data that helps connect a problem on the ground with a practical next step.

What we're actually looking for
Water goes where the ground tells it to. A fairway that stays wet, a bunker that repeatedly washes out, or a cart path that collects runoff may be part of a larger terrain problem rather than an isolated maintenance issue. Drainage is essential to firm, healthy playing conditions, but understanding the surrounding elevations is an important starting point before deciding where to make changes.
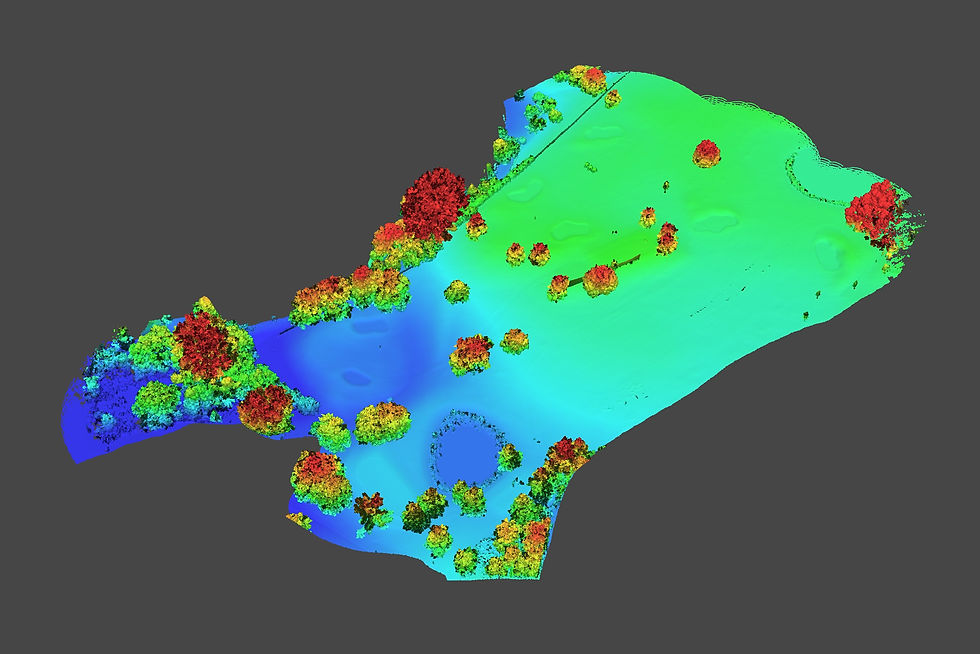
LiDAR collects millions of individual measurements to create a three-dimensional point cloud. Those points can be classified to separate ground from trees, buildings, and other above-ground features. The ground measurements form a digital terrain model, or DTM — a foundation for topographic maps, contours, slope analysis, and investigation of likely surface-water movement.
For a superintendent, that means a way to connect recurring trouble spots with the terrain around them. For an engineer or course architect, it provides existing-condition information to support drainage and renovation planning. It does not replace soil testing, drainage-system investigation, or professional design, but it helps those efforts start with a clearer picture.
Why water management and sustainability go together
Golf courses face two related challenges: supplying water where turf needs it and moving excess water away from areas where it causes problems. The USGA’s water-conservation guidance emphasizes irrigation efficiency, better information, and reducing irrigated acreage where practical. Terrain mapping supports that work by showing the slopes, low areas, and drainage relationships that influence how water moves across a property.
A LiDAR terrain model can help identify depressions where water may collect, slopes that direct runoff toward playing areas, and locations where grading or drainage improvements deserve closer evaluation. Combined with irrigation records, soil-moisture readings, and field observations, it gives the maintenance team more context for understanding why one area stays wet while another dries out. LiDAR itself does not measure soil moisture or determine irrigation requirements.
Sustainability also involves deciding which acres need intensive maintenance. Converting suitable out-of-play areas to naturalized vegetation can reduce water use and maintenance inputs while providing habitat and stormwater-filtration benefits. Mapping helps a course team evaluate the size, slope, and location of candidate areas before making changes. Those areas still need thoughtful planning and ongoing care — “naturalized” does not mean maintenance-free.
How the maps support everyday decisions
Different views answer different questions. A realistic 3D view helps people recognize the course, while terrain and surface models reveal relationships that may be difficult to see during a walk-through.
DTM: Represents the ground surface with above-ground features removed through classification. It supports contour mapping, slope analysis, and drainage planning.
Hillshade: Uses simulated lighting to emphasize terrain shape. It makes subtle swales, ridges, and depressions easier to see, but it is a visualization — not a water-flow calculation.
DSM: Represents the upper surface, including trees and structures. Compared with the ground model, it helps describe above-ground features and their relationship to the course.
3D view: Gives superintendents, board members, contractors, and designers a shared visual reference for discussing locations and proposed work.
The practical applications extend beyond a single drainage concern:
Drainage and playability: Investigate low spots, contributing slopes, and potential surface-flow routes around fairways, bunkers, and paths.
Renovation planning: Provide terrain information for evaluating grading options, drainage improvements, and earthwork quantities.
Maintenance priorities: Help evaluate where changes to maintained acreage could reduce recurring work and redirect resources toward primary playing areas.
Project logistics: Give the project team a common base map for discussing work areas, access, and the relationship between proposed improvements and existing course features.
The map does not make the decision for the superintendent. It helps the superintendent explain the problem, compare options, and direct the right specialists to the right location.

The process, start to finish
It starts with a short scoping call: are we investigating persistent wet areas, preparing for a renovation, evaluating naturalized acreage, or establishing a baseline for future comparisons? That question determines the coverage, required accuracy, and deliverables.
Aerial LiDAR can collect broad course coverage efficiently, making it a cost-effective option when the alternative involves extensive point-by-point ground measurements. The savings depend on acreage, access, vegetation, accuracy requirements, and the amount of processing and analysis needed. Fast collection is an advantage, but the useful result comes from classification, quality checks, and maps prepared for the intended task.
Deliverables can include a classified point cloud, DTM, DSM, hillshade, contours, and targeted slope or drainage analysis. Where positional accuracy matters, independent checkpoints help verify the finished data rather than relying only on the equipment’s specifications.
That first scan also establishes a baseline. Repeat scans can help document grading changes, erosion, or completed renovation work. Meaningful comparisons require consistent coordinate systems and vertical references, careful alignment, and changes large enough to distinguish from measurement uncertainty. A different color on next year’s map is not, by itself, proof that the ground moved.
Common questions
Can LiDAR show why a fairway stays wet?
It can reveal terrain conditions that may contribute to the problem, including low spots, shallow slopes, and surrounding areas that direct runoff toward the fairway. But persistent wetness can also involve soil characteristics, a high water table, irrigation, or failing drainage infrastructure. The terrain model helps guide the investigation; it does not diagnose every cause on its own.
Can it help us use less water?
It can support a water-conservation plan by providing terrain information for irrigation and drainage planning and helping evaluate areas where irrigated turf might be reduced. Actual irrigation decisions still require information about weather, soils, turf needs, and system performance. LiDAR is one useful layer in that decision, not a replacement for those measurements.
Can LiDAR capture the ground around trees?
Often, yes. Some laser measurements pass through gaps in the canopy and reach the ground, allowing ground points to be separated from vegetation. Dense foliage and understory can limit coverage, so collection timing and quality checks matter. Leaf-off conditions can be especially helpful where wooded terrain is important to the project.
How precise is the data?
Accuracy depends on the collection method, positioning, vegetation, processing, and validation. The right specification depends on the decision you need to make: a course-wide planning map and a detailed putting-green grading assessment do not necessarily require the same level of accuracy. We scope the work around the intended use and identify how the results will be checked.
Do we need to scan the entire course every year?
Not necessarily. A course-wide baseline can support longer-term planning, while follow-up scans can focus on renovation areas or locations where change is suspected. Repeat mapping is most useful when it answers a defined question — such as how much grading occurred or whether an erosion area changed — and the comparison accounts for the accuracy of both datasets.
What areas do you cover?
The Minneapolis–St. Paul metro and surrounding region — including Stillwater, Rochester, Duluth, Wisconsin and Iowa
— with travel for larger golf-course and land-planning projects.
Next Step
Have a fairway that stays wet, a drainage concern that keeps returning, or improvements planned for next season? Start with a clearer picture of the ground. We’ll discuss the problem, identify the areas that need attention, and scope a LiDAR data scan with maps and models suited to your superintendent, engineer, or course architect.
You don’t have to wait until spring. Winter LiDAR scanning is possible when the ground is free of snow and ice and weather conditions allow safe collection. Leaf-off conditions can also improve ground coverage around deciduous trees, making suitable winter windows valuable for terrain mapping.
Reach out with the problem you’re trying to solve — whether it’s managing water, planning a renovation, or establishing a baseline for future comparisons. Let’s turn your course’s existing conditions into useful information for the next decision.
ABOUT THE AUTHOR

Earl Bakke turns complex sites into clear, actionable information. As founder of ScenePhoto360 in Stillwater, Minnesota, he combines LiDAR mapping, thermal imaging, and 3D modeling to help clients understand terrain, investigate building concerns, and plan improvements. His project-specific deliverables range from bare-earth terrain models and topographic maps to slope, drainage, and 3D visualizations — built around the question each client needs answered. A Level II Certified Thermographer and FAA Part 107 pilot, Earl brings 20 years in law enforcement and crash reconstruction, 450+ forensic and inspection missions, and experience testifying in criminal and civil proceedings. His focus: data that does more than look impressive — it helps people make informed decisions.